
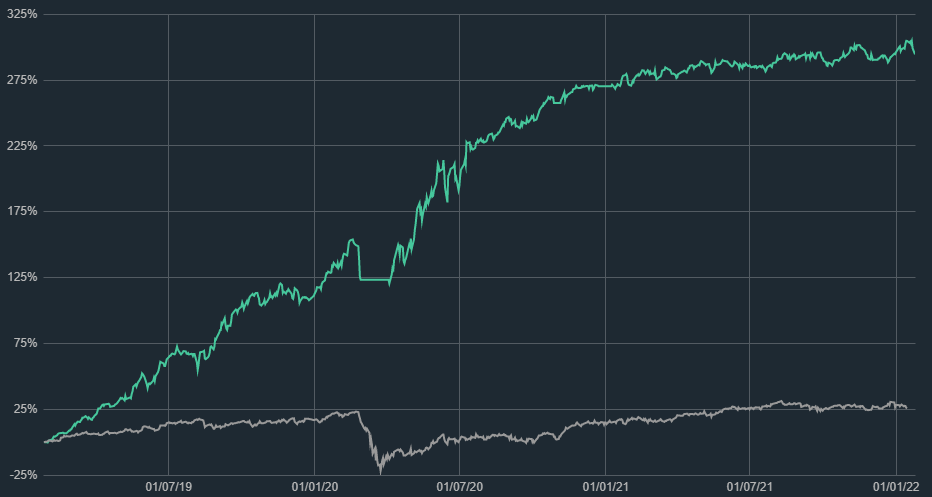
Suubee leaders
list performance
This graph illustrates the out performance of our Suubee leaders list compared to the ASX all ordinaries.
Assumptions
- Each stock on Suubee leaders list is assigned an equally weighted portion of a portfolio
- No brokerage/slippage costs
- Portfolio reweighing at end of each trading day if stocks are added/removed
- We assume this portfolio went to 100% cash on the close of 27th February along with the Sell signal provided to members and all names being removed from Leaders list.
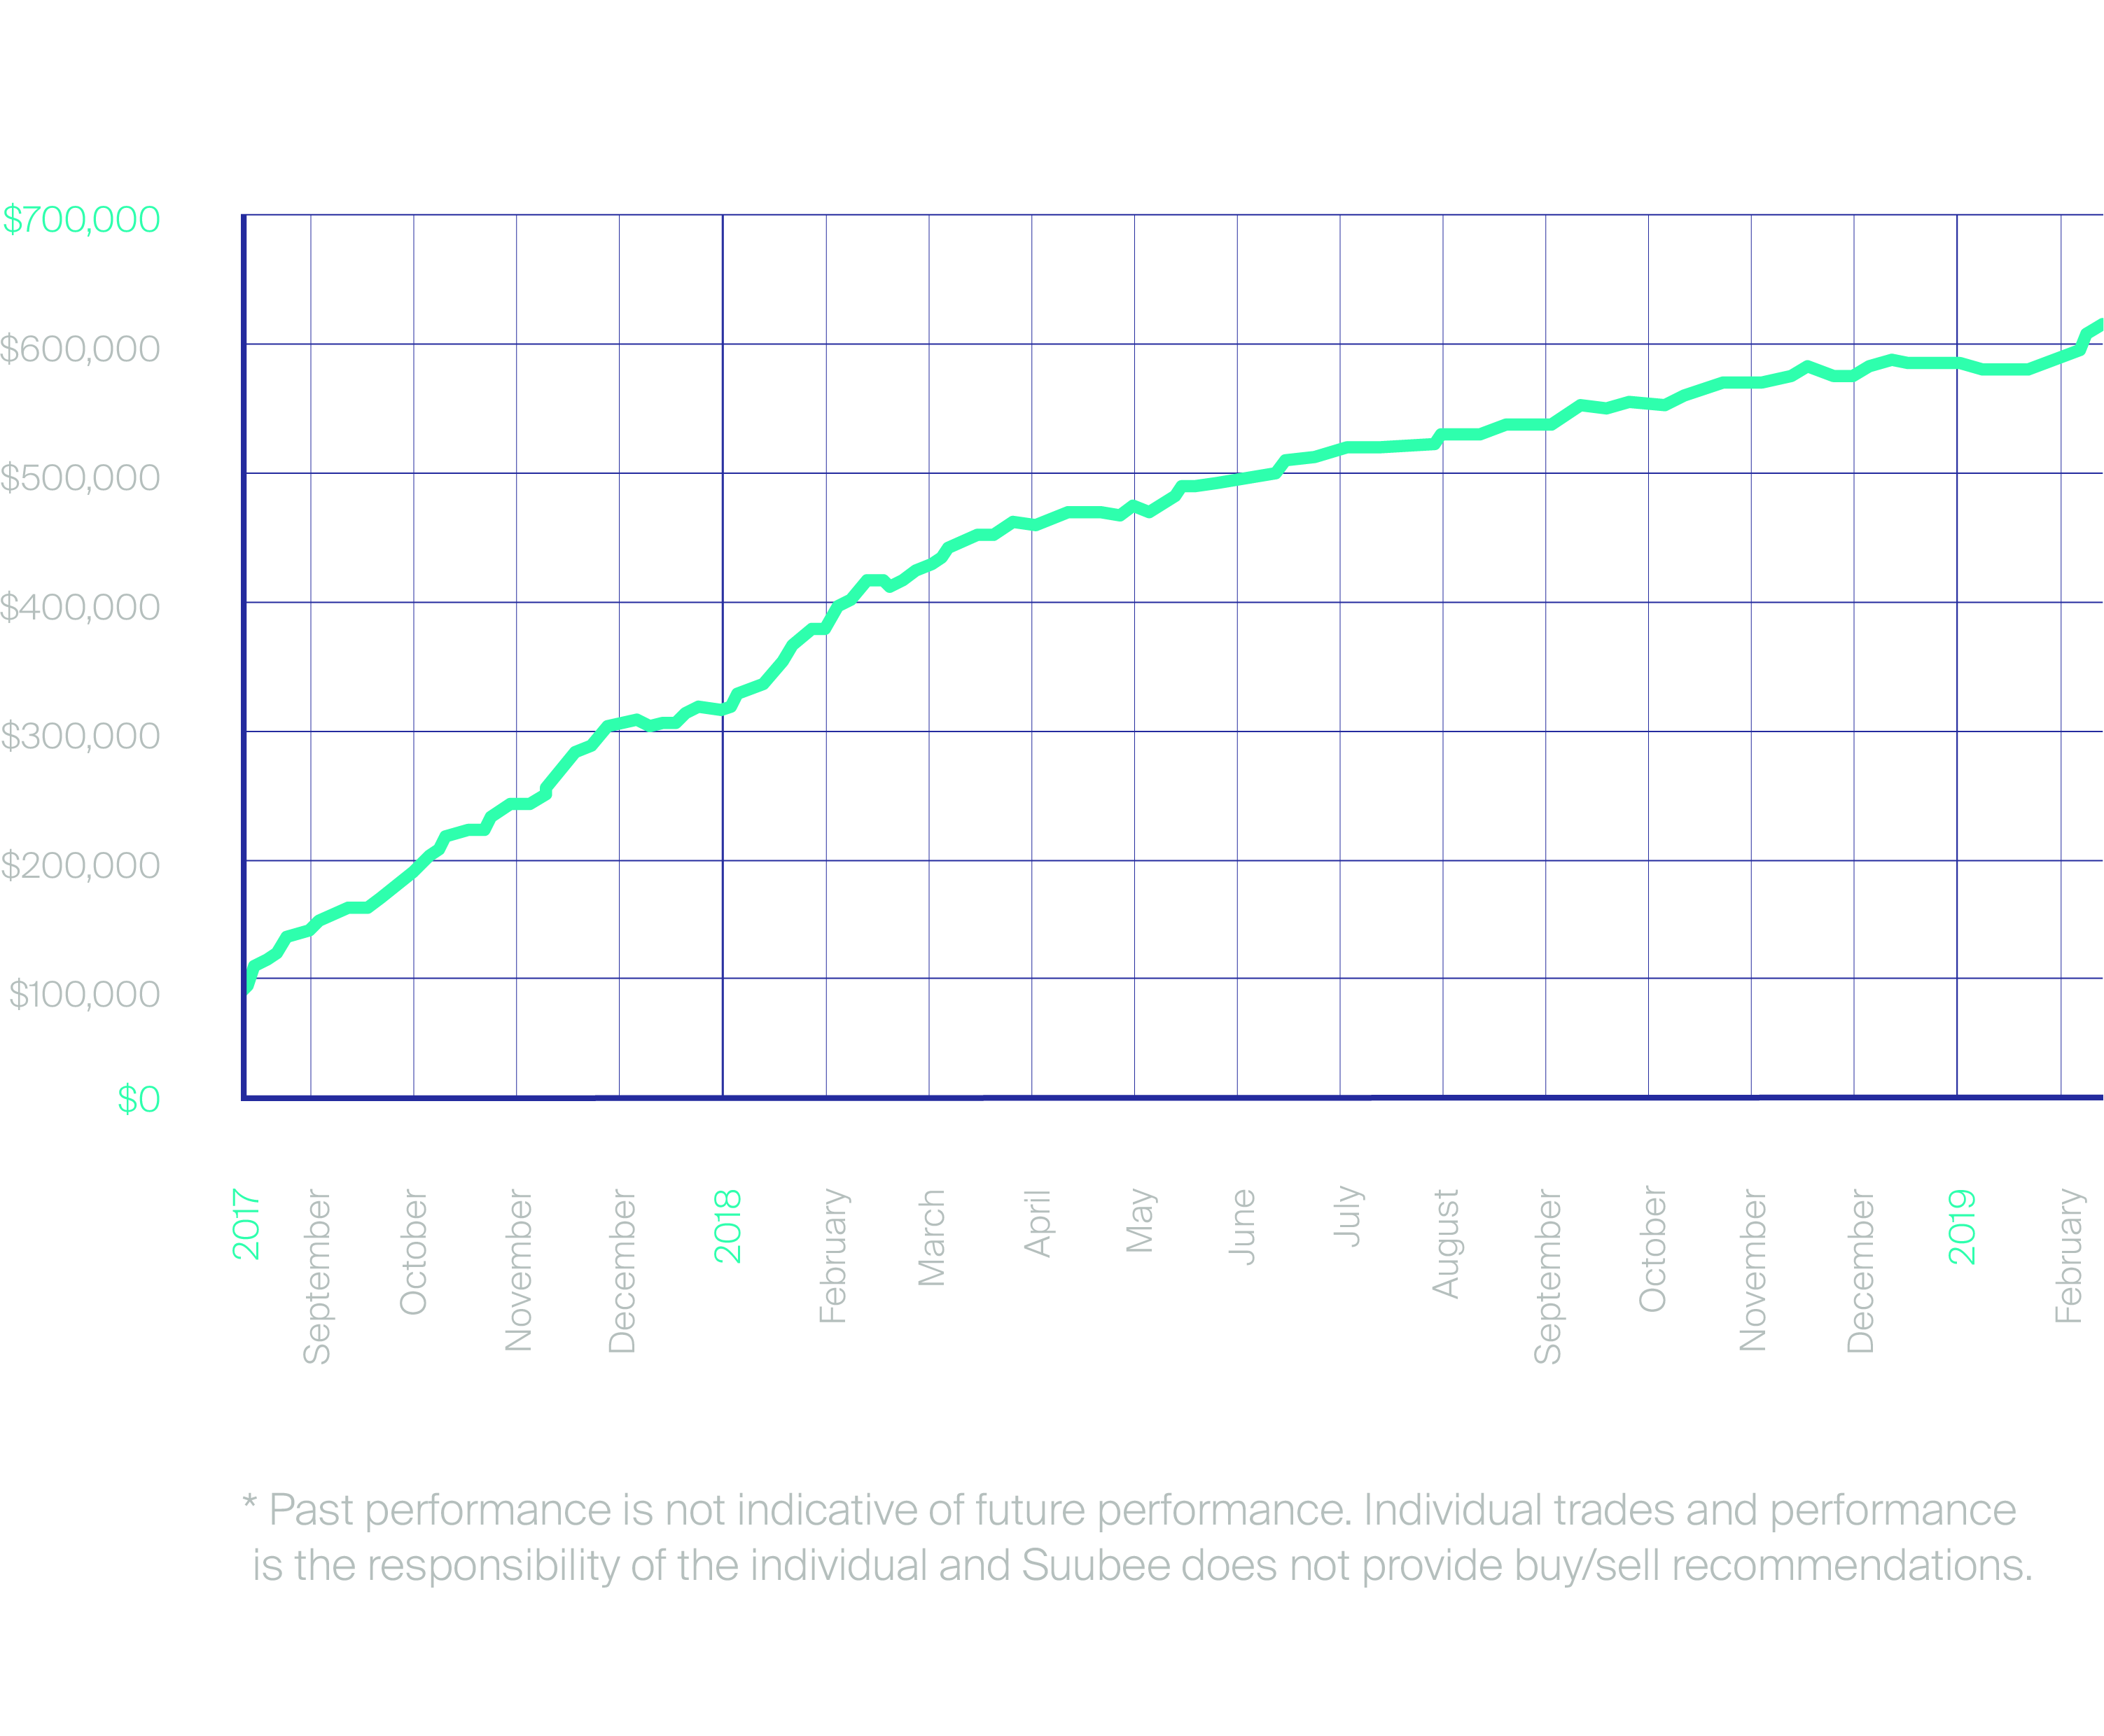
Suubee equity curve
The following graph outlines the performance of our Suubee traders from September 2017 to March 2019.
Assumptions
- Assumes a starting portfolio value of $100,000.
- All trades were taken at the buy & sell points published on Suubee.com by all traders.
- All trades were taken with a constant $10,000 position size.
- Total portfolio exposure may have exceeded 100% at any point (More than 10 positions open).
- Brokerage commissions were calculated at a flat $8 per trade.
- All open position as at 6th March were “Closed” for the purpose of this graph.
Suubee Premium is an exclusive education and mentorship program developed to create the next generation of professional traders.
Let’s talk: info@suubee.com
Suubee Premium is an exclusive education and mentorship program developed to create the next generation of professional traders.
Let’s talk: info@suubee.com
© 2020 Subbee Premium
SUUBEE PTY LTD
ABN: 35 605 760 496
(03) 9010 6262
info@suubee.com
© 2020 Subbee Premium
SUUBEE PTY LTD
ABN: 35 605 760 496
(03) 9010 6262
info@suubee.com